How to Choose the Top Option Trading Academy in India
Option trading has become one of the most popular ways to participate in the stock market. However, becoming a successful option trader requires more than understanding how to buy and sell options. It involves learning market fundamentals, risk management, trading psychology, and proven trading strategies. This is why choosing the right option trading academy is an important step for anyone who wants to build strong trading skills.
With many trading institutes offering different courses, finding the top option trading academy in India can be challenging. Every academy has its own teaching style, course structure, and level of practical training.
In this complete guide, we will explain how to choose the top option trading academy in India, the key factors to consider before joining a course, common mistakes to avoid, and the features that make a quality trading academy.
Why Professional Training Is Important
Many people start option trading by watching videos, reading articles, or following tips on social media. While these resources can provide basic information, they often do not offer a structured learning path. As a result, beginners may develop incorrect trading habits or make costly mistakes due to a lack of proper knowledge.
Professional training provides a step-by-step approach to learning option trading. It helps traders understand important concepts such as market fundamentals, option strategies, technical analysis, risk management, trading psychology, and money management. Learning these concepts in a structured way allows traders to build a strong foundation before trading with real capital.
Another advantage of professional training is practical learning. Many option trading academies include live market sessions, real trading examples, and mentor guidance, helping students understand how trading strategies work in different market conditions. This practical experience improves decision-making and builds confidence over time.
Choosing professional training does not guarantee trading success, but it can help traders develop the knowledge, discipline, and skills needed to make more informed trading decisions and continue learning throughout their trading journey.
Benefits of Structured Trading Education
Structured trading education helps traders learn option trading in a clear and organized way. Instead of learning random concepts from different sources, traders follow a step-by-step learning process that builds their knowledge gradually. This makes it easier to understand the basics before moving on to more advanced trading strategies.
One of the biggest benefits of structured learning is that it covers all the important topics needed for successful trading. These include stock market fundamentals, option trading concepts, technical analysis, option strategies, risk management, money management, and trading psychology. Learning these topics in the right order helps traders develop a strong foundation and avoid common beginner mistakes.
Structured trading education also provides practical learning through live market examples, chart analysis, and guided trading sessions. This allows traders to understand how different strategies work in real market conditions instead of relying only on theory. As they gain experience, they become more confident in analyzing the market and making informed trading decisions.
Another advantage is the support and guidance available from experienced trainers. Traders can clear their doubts, receive feedback, and continue improving their skills through regular practice. Whether you are a beginner or an experienced trader, structured trading education provides a systematic approach that helps you learn more effectively and build long-term confidence in option trading.
Why Choosing the Right Option Trading Academy Matters
Choosing the right option trading academy is one of the most important decisions for anyone who wants to learn trading seriously. A good academy does more than teach trading strategies—it helps you understand how the market works, manage risk, and develop the discipline needed to make informed trading decisions. Learning from a structured and reliable academy can make your trading journey more organized and help you avoid many common beginner mistakes.
1. Builds Strong Market Fundamentals
Every successful trader starts with a strong understanding of the basics. A good option trading academy teaches important concepts such as the stock market, option trading fundamentals, market terminology, and how different financial instruments work. Building a strong foundation makes it easier to understand advanced trading concepts later.
2. Helps Reduce Beginner Mistakes
Many beginners make mistakes because they start trading without proper knowledge or a clear plan. They may enter trades based on emotions, market tips, or incomplete information. A structured trading course helps learners understand common mistakes and teaches them how to avoid them through proper planning and disciplined trading practices.
3. Improves Risk Management Skills
Risk management is an essential part of option trading. A good trading academy teaches traders how to manage their capital, use stop-loss orders effectively, calculate position size, and maintain a suitable risk-reward ratio. These skills help traders reduce unnecessary losses and make more informed trading decisions.
4. Provides Practical Market Experience
Learning only from books or videos is often not enough. Practical experience helps traders understand how the market behaves in real-time. Many option trading academies include live market sessions, chart analysis, and real trading examples so that students can see how trading concepts are applied in different market conditions.
5. Builds Long-Term Trading Confidence
Confidence in trading comes from knowledge, practice, and experience. A good option trading academy helps traders build confidence by providing structured learning, practical guidance, and continuous support. As traders improve their understanding of the market and gain experience, they become more comfortable analyzing opportunities and making informed trading decisions over the long term.
How to Choose the Top Option Trading Academy in India
Choosing the right option trading academy is an important step in building a successful trading journey. With many academies offering different courses and learning methods, it is essential to evaluate them carefully before enrolling. A good academy should provide structured education, practical learning, experienced guidance, and ongoing support to help traders develop the skills needed to trade confidently. Here are some important factors to consider when choosing the top option trading academy in India.
1. Check the Course Curriculum
The first thing to look at is the course curriculum. A well-designed course should cover both basic and advanced topics, including option trading fundamentals, technical analysis, option strategies, risk management, trading psychology, and money management. A comprehensive curriculum helps traders build knowledge step by step.
2. Look for Experienced Trainers
Learning from experienced trainers can make a significant difference. Trainers with practical market experience can explain trading concepts more effectively and share real-world insights that go beyond textbook knowledge. Their guidance can help traders better understand market behavior and improve their decision-making skills.
3. Choose Practical Learning Over Theory
Theory is important, but practical learning is equally essential. A good trading academy should teach concepts through real market examples, chart analysis, and strategy demonstrations. This helps students understand how trading strategies work in actual market conditions and prepares them for real trading situations.
4. Live Market Training
Live market training allows students to observe how experienced traders analyze the market and make trading decisions during market hours. It helps learners understand price movements, market trends, and trading opportunities in real time. This practical exposure can improve learning and build confidence.
5. Trading Psychology Training
Successful trading is not only about strategies; it also depends on controlling emotions and following a disciplined approach. A good academy should include trading psychology as part of its curriculum. Learning how to manage fear, greed, and emotional decision-making can help traders develop better trading habits.
6. Risk Management Education
Risk management is one of the most important aspects of option trading. Before joining an academy, check whether it teaches topics such as stop-loss placement, position sizing, money management, and risk-reward ratio. These skills help traders protect their capital and manage trades more effectively.
7. Beginner-Friendly Learning
If you are new to option trading, choose an academy that offers beginner-friendly courses. The learning process should be simple, well-structured, and easy to follow. A gradual approach helps beginners understand the basics before moving on to advanced trading concepts.
8. Advanced Trading Modules
As traders gain experience, they need to learn more advanced concepts. A good option trading academy should also offer advanced modules covering topics such as option strategies, option chain analysis, price action, market analysis, and advanced risk management. This allows traders to continue improving their skills over time.
9. Student Support and Mentorship
Learning continues even after completing a course. A good option trading academy should provide student support and mentorship to help learners clear their doubts and continue improving. Regular guidance, doubt-clearing sessions, and access to mentors can make the learning process more effective and help traders stay motivated throughout their trading journey.
Questions to Ask Before Joining an Option Trading Academy
Before enrolling in an option trading academy, it is important to ask the right questions. Doing a little research can help you choose a course that matches your learning goals and provides practical knowledge. A good academy should offer structured learning, experienced guidance, and continuous support to help you build your trading skills. Here are some important questions to consider before making your decision.
1. Is the Course Suitable for Beginners?
If you are new to option trading, make sure the course starts with the basics before moving to advanced topics. A beginner-friendly course should explain market fundamentals, option trading concepts, and basic strategies in a simple and easy-to-understand manner.
2. Does It Cover Risk Management?
Risk management is an essential part of successful trading. Before joining an academy, check whether the course teaches important topics such as stop-loss placement, position sizing, money management, and risk-reward ratio. These skills help traders protect their capital and make informed trading decisions.
3. Are Live Trading Sessions Included?
Live trading sessions give students the opportunity to see how trading concepts are applied in real market conditions. Watching experienced trainers analyze charts, identify trading opportunities, and manage trades can improve practical understanding and confidence.
4. What Is the Learning Format?
Different academies offer different learning formats, such as online classes, offline classroom sessions, or a combination of both. Choose a format that suits your schedule, learning style, and convenience. Also, check whether recorded sessions or study materials are available for future reference.
5. Does the Academy Offer NISM-Certified Trading Education?
NISM-certified trading education helps learners build a strong understanding of the financial markets through a structured learning approach. Before joining an option trading academy, check whether it offers NISM-certified trading education or follows industry-recognized learning standards. This can help you gain a better understanding of stock market concepts, option trading, market analysis, and trading practices. Learning through a structured and recognized program can provide a solid foundation for your long-term trading journey.
6. Does the Course Cover Risk, Mind, and Money Management?
Successful trading is not only about finding the right entry and exit points. It also depends on how well you manage risk, your trading mindset, and your capital. Before joining an academy, check whether the course teaches risk management techniques, trading psychology, emotional discipline, and money management strategies. Learning these skills can help traders make more informed decisions, control emotions during market fluctuations, and develop a disciplined approach to long-term trading.
Common Mistakes to Avoid When Choosing an Academy
Choosing the right option trading academy is just as important as learning the right trading strategies. Many people join a course without doing enough research and later realize that it does not meet their expectations or learning needs. Avoiding a few common mistakes can help you select an academy that provides quality education, practical learning, and long-term value. Here are some mistakes you should avoid before enrolling in an option trading academy.
1. Choosing Only Based on Fees
One of the biggest mistakes people make is selecting an academy only because it offers the lowest course fee. While cost is an important factor, it should not be the only reason for your decision.
Instead, compare the course curriculum, trainer experience, practical learning opportunities, mentorship, and student support. A course that provides structured learning and quality education may offer better long-term value than choosing the cheapest option.
2. Expecting Guaranteed Profits
Be cautious of any academy that promises guaranteed profits or guaranteed trading success. The stock market is influenced by many factors, and no training institute can guarantee profits in every market condition.
A good option trading academy focuses on teaching market knowledge, trading strategies, risk management, and disciplined trading practices rather than making unrealistic promises. The goal of professional training is to help you become a more informed and confident trader.
3. Ignoring the Course Curriculum
Before joining any academy, carefully review what the course includes. Some courses may focus only on basic concepts, while others provide a complete learning path from beginner to advanced levels.
Look for a curriculum that covers option trading fundamentals, technical analysis, option strategies, trading psychology, market analysis, and risk management. A well-structured course helps you build knowledge step by step and prepares you for different market conditions.
4. Not Researching the Trainers
The quality of your learning often depends on the experience and teaching style of the trainers. Before enrolling, take some time to learn about the trainers, their market experience, and their approach to teaching.
Experienced trainers can explain complex concepts in a simple way and provide practical insights based on real market situations. Learning from knowledgeable mentors can make your trading journey more effective.
5. Ignoring Student Reviews
Student reviews can provide useful information about the quality of a trading academy. Reading genuine reviews and testimonials can help you understand the learning experience, teaching methods, student support, and overall satisfaction of previous learners.
While reviews should not be the only deciding factor, they can give you a better idea of whether the academy delivers on its promises.
6. Joining Without Clear Learning Goals
Many people enroll in a trading course without knowing what they want to achieve. Before choosing an academy, define your learning objectives. For example, you may want to learn the basics of option trading, improve your technical analysis skills, understand risk management, or learn advanced option trading strategies.
Having clear goals makes it easier to choose a course that matches your needs and helps you stay focused throughout your learning journey. A trading academy that aligns with your goals can provide a more meaningful and effective learning experience.
What Should You Learn in an Option Trading Course?
A good option trading course should do more than explain how options work. It should help you build a strong understanding of the stock market, teach you how to analyze market movements, manage trading risks, and develop the confidence to make informed trading decisions. Whether you are a beginner or an experienced trader, choosing a course that covers both theoretical concepts and practical applications is essential for long-term growth.
Before joining the top option trading academy in India, make sure the course includes the following important topics.
1. Stock Market Basics
Every trader should begin by learning the fundamentals of the stock market. Understanding how the market operates provides a strong foundation for learning option trading.
A good course should explain topics such as stock exchanges, market participants, different financial instruments, order types, trading sessions, and how stock prices move. Learning these basics helps traders understand the overall market before moving on to advanced trading concepts.
2. Option Trading Fundamentals
Once you understand the stock market, the next step is learning the basics of option trading.
The course should explain concepts such as Call Options, Put Options, strike price, expiry date, option premium, intrinsic value, time value, and how option contracts work. Understanding these fundamentals is essential before learning advanced option trading strategies.
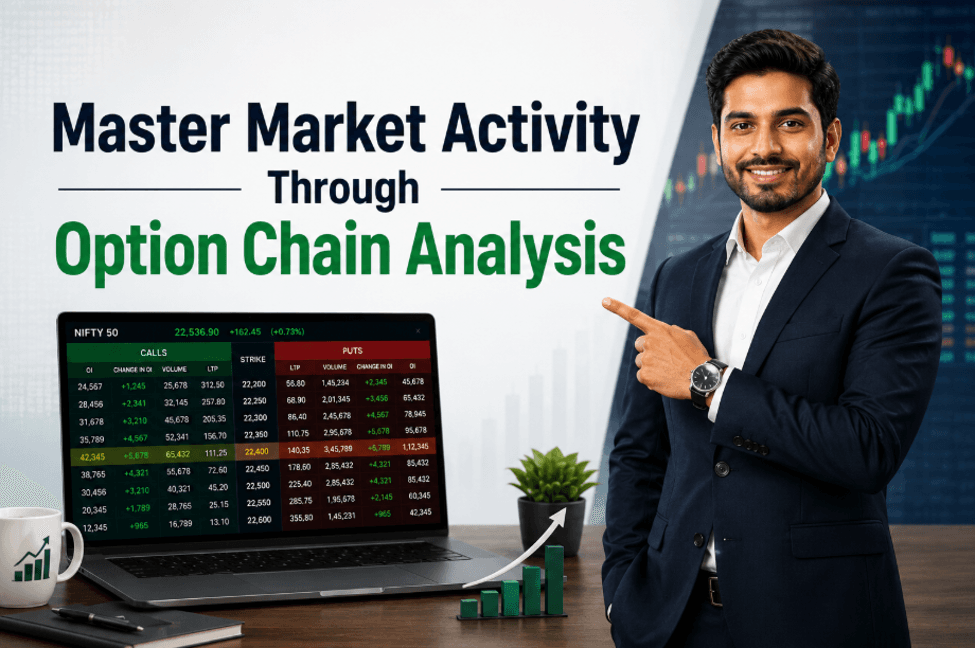
3. Option Chain Analysis
Option Chain Analysis is one of the most valuable skills for option traders. It helps traders understand market sentiment by analyzing available option contracts for different strike prices and expiry dates.
A quality trading course should teach how to read an option chain, identify support and resistance levels, analyze option premiums, and use option chain data to make better trading decisions.
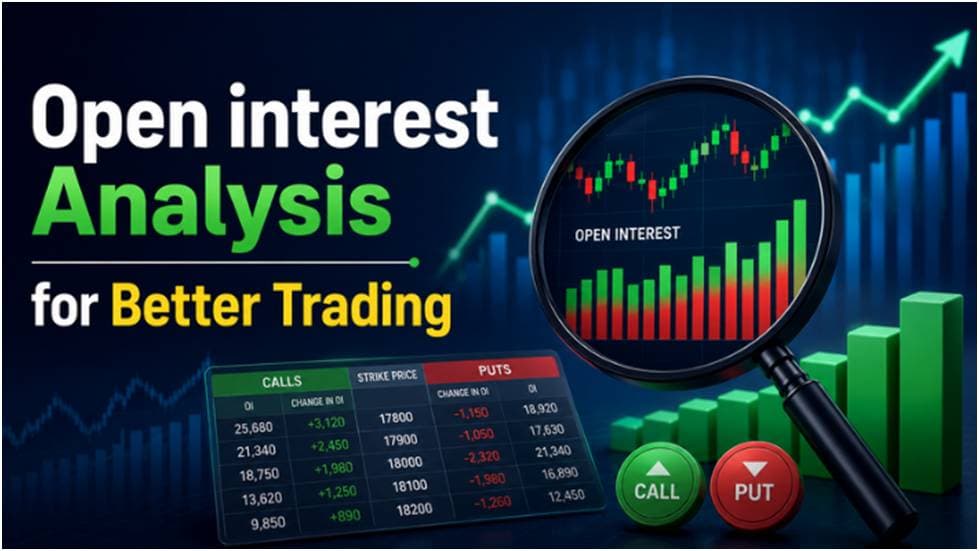
4. Open Interest Analysis
Open Interest Analysis helps traders understand the strength of market trends by studying the number of outstanding option contracts.
A good course should explain how changes in open interest can indicate buying or selling activity, trend continuation, or possible reversals. Learning Open Interest Analysis can improve market analysis and support better trading decisions.
5. Price Action
Price Action is the study of price movement without depending heavily on indicators. Many experienced traders use price action to identify trading opportunities and understand market behavior.
An option trading course should teach candlestick patterns, support and resistance, trendlines, breakouts, reversals, and chart patterns. These concepts help traders analyze the market directly through price movement.
6. Technical Analysis
Technical analysis is another important part of option trading. It helps traders study historical price movements and identify potential trading opportunities using charts and indicators.
Learning technical analysis can improve trade planning and market timing.
7. Trading Psychology
Successful trading is not only about knowledge—it also depends on controlling emotions. Fear, greed, overconfidence, and impatience can affect trading decisions and lead to unnecessary losses.
A good option trading course should teach trading psychology, emotional discipline, patience, and how to follow a trading plan. Developing the right mindset is essential for long-term success in the stock market.
8. Money Management
Money management teaches traders how to manage their trading capital wisely. Even profitable traders can face losses if they do not manage their capital properly.
A quality course should explain position sizing, capital allocation, portfolio management, and how much capital to risk on each trade. Good money management helps traders stay consistent and protect their trading capital.
9. Risk Management
Risk management is one of the most important skills every trader should learn. Every trade carries some level of risk, and managing that risk is essential for long-term success.
An option trading course should teach stop-loss placement, risk-reward ratio, position sizing, and strategies to limit losses during changing market conditions. Learning risk management helps traders protect their capital and trade with greater confidence.
10. Trading Strategies
A complete option trading course should also teach practical trading strategies that can be applied in different market conditions.
These may include bullish, bearish, and neutral option strategies, intraday trading strategies, swing trading approaches, expiry trading techniques, option buying and option selling strategies, and methods for selecting the right strike price and expiry. Along with learning these strategies, traders should also understand when to use them, why they work, and how to manage risk while applying them in real market conditions.
A well-structured course that covers all these topics provides traders with the knowledge and practical skills needed to build a strong foundation in option trading. It also prepares them to analyze the market with confidence and continue improving as they gain experience.
Why NISM-Certified Education Matters
When choosing the top option trading academy in India, it is important to look beyond the course curriculum and teaching methods. One factor that adds value to a trading academy is whether it has NISM Certified Educators. Learning from educators who hold recognized industry certifications can help traders build a stronger understanding of the financial markets and develop the knowledge needed to make informed trading decisions.
1. What Is NISM?
NISM (National Institute of Securities Markets) is an educational institution established by the Securities and Exchange Board of India (SEBI) to promote investor education and improve knowledge of the Indian securities market.
NISM develops educational programs, certifications, and learning resources related to the stock market, mutual funds, derivatives, investment products, and financial markets. Its certifications are widely recognized within the Indian financial industry and are designed to help individuals understand market concepts, regulations, and professional trading practices.
Learning from NISM Certified Educators allows students to gain knowledge from trainers who understand these industry standards and can explain financial market concepts in a structured and practical manner.
2. Benefits of Learning from NISM Certified Educators
Learning from NISM Certified Educators offers several advantages for individuals who want to improve their understanding of the stock market and option trading. Here are the key benefits:
● Learn from educators with recognized industry certifications.
● Build a strong understanding of stock market and option trading concepts.
● Gain knowledge through a structured learning approach.
● Improve your understanding of market regulations and trading practices.
● Learn practical trading concepts alongside theoretical knowledge.
● Develop better analytical and decision-making skills.
● Build confidence through guidance from qualified educators.
While learning from NISM Certified Educators does not guarantee trading success, it provides a strong educational foundation that helps traders make informed decisions and continue improving their skills.
3. Why Traders Should Learn from NISM Certified Educators
Learning option trading requires more than understanding charts and trading strategies. Traders also need knowledge of market fundamentals, risk management, trading psychology, and disciplined trading practices. This is where NISM Certified Educators can add significant value.
Educators with NISM certifications bring structured knowledge and industry-recognized expertise to the learning process. They can help students understand complex trading concepts in a simple and practical way while connecting theory with real market situations.
So, when searching for the best option trading institute in India, consider whether the academy has NISM Certified Educators who provide practical guidance, structured learning, and real market insights. Learning from qualified educators can help build a stronger foundation and support your long-term growth as an option trader.
Why TSTA Is a Trusted Choice for Option Trading Education
Choosing the right academy is an important step in becoming a successful option trader. At Trade Sutra Trading Academy (TSTA ), our focus is on providing practical, structured, and beginner-friendly trading education that helps students build knowledge and confidence.
From market fundamentals to advanced option trading concepts, our courses are designed to help learners understand the markets through real examples, expert guidance, and continuous learning.
1. Practical Learning Approach
At TSTA, we believe that trading is best learned through practical experience. Instead of focusing only on theory, we explain concepts using real market examples, live charts, and practical trading scenarios. This approach helps students understand how trading strategies work in actual market conditions.
2. Learn from NISM Certified Educators
Our students learn from NISM Certified Educators who bring structured knowledge and industry-recognized expertise to every session. They explain trading concepts in a simple and practical manner, helping learners build a strong understanding of the stock market and option trading.
3. Live Market Sessions
TSTA offers live market sessions where students can observe how experienced traders analyze market movements and identify trading opportunities. These sessions help learners understand market behavior, improve analysis skills, and gain practical exposure to real-time trading.
4. Step-by-Step Learning for Beginners
Our courses are designed to support learners at every stage. Beginners start with stock market basics and option trading fundamentals before progressing to more advanced topics. This structured learning path makes it easier to understand complex concepts without feeling overwhelmed.
5. Comprehensive Option Trading Strategies
Students at TSTA learn a wide range of option trading strategies suitable for different market conditions. From beginner-friendly strategies to more advanced approaches, we help learners understand when and how to apply different strategies while maintaining a disciplined trading approach.
6. Price Action Trading Training
Price action is an important part of market analysis. At TSTA, students learn how to read candlestick patterns, identify support and resistance levels, recognize chart patterns, and understand market trends. This helps them make trading decisions based on price movement rather than relying only on indicators.
7. Option Chain & Open Interest Analysis
Understanding option chain data and open interest is essential for option traders. Our training explains how to read option chain data, analyze open interest changes, identify support and resistance levels, and use this information to understand market sentiment and improve trading decisions.
8. Time Management for Traders
Successful trading also requires proper time management. At TSTA, students learn how to prepare before the market opens, plan their trading day, avoid unnecessary trades, and focus on quality opportunities instead of trading continuously. Good time management helps traders remain disciplined and organized.
9. Money Management Techniques
Protecting trading capital is just as important as earning profits. Our courses teach practical money management techniques, including capital allocation, position sizing, and managing trading funds responsibly. These concepts help students build long-term trading discipline.
10. Risk Management Training
Risk management is a core part of every TSTA course. Students learn how to place stop-loss orders, calculate risk-reward ratios, manage position sizes, and protect their capital during different market conditions. Developing these skills helps traders make more informed decisions.
11. Trading Psychology & Emotional Discipline
Emotions can affect trading decisions. At TSTA, we help students understand the importance of trading psychology, emotional discipline, patience, and following a trading plan. Learning to control fear, greed, and impulsive decisions can improve consistency in trading.
12. Beginner to Advanced Learning Path
Whether you are completely new to the stock market or already have trading experience, TSTA offers courses that match your learning level. Students can gradually move from basic concepts to advanced option trading techniques, allowing them to continue improving their knowledge and skills.
Explore Our Trading Courses
At Trade Sutra Trading Academy (TSTA ), we offer a range of specialized trading courses designed to help learners build practical trading skills across different market segments. Whether you want to trade Nifty options, Stock Options, Futures, or build a long-term stock portfolio, our courses provide structured learning through practical examples, price action, and disciplined trading methods. Each course is designed to help traders understand the market with clarity and apply strategies confidently.
1. TSTA Nifty Ninja
If you are searching for the best options trading course online, TSTA Nifty Ninja is designed to help you master Nifty Option Buying through a practical and structured approach. Instead of relying on trading signals or complicated indicators, this course focuses on understanding price action, identifying market direction, selecting the right entry, placing stop-loss orders, and managing trades with confidence.
Suitable for both beginners and active traders, TSTA Nifty Ninja helps you develop a disciplined trading approach and improve consistency while trading Nifty options.
2. TSTA Futures Pro
TSTA Futures Pro helps traders learn how to trade Index Futures and Stock Futures using a systematic price-action-based approach. The course covers both buying and selling opportunities while teaching students how to identify trading setups, plan entries and exits, manage futures positions, understand rollovers, and re-enter trades when suitable.
The focus is on building confidence and making logical trading decisions instead of relying on random strategies.
3. TSTA Stock Star
TSTA Stock Star is designed for traders and investors who want to build a strong understanding of the equity market. The course teaches how to analyze stocks, identify quality investment opportunities, manage portfolio risk, and make informed buy and sell decisions.
Instead of random stock selection, students learn a disciplined approach to building and managing a long-term investment portfolio.
4. TSTA Strike Smart
TSTA Strike Smart is a specialized course for Stock Option Buying. It teaches traders how to select the right strike price, understand price action, identify trading opportunities, and plan entries and exits with confidence.
Whether you are new to stock options or already have trading experience, this course helps you build a structured approach to option buying with improved trade planning and risk control.
5. TSTA Premium Power
TSTA Premium Power focuses on Stock Option Selling using a disciplined and data-driven approach. The course explains how to identify suitable market conditions for option selling, understand premium decay, analyze market data, and manage positions effectively.
Students learn how to sell options with proper planning, risk management, and logical decision-making instead of relying on emotional or random trading methods.
With these specialized courses, TSTA provides learners with practical knowledge, structured learning, and guidance across different trading styles, helping them choose the course that best matches their trading goals and experience level.
Why Choose TSTA
Choosing the right trading academy is about more than just enrolling in a course. Traders look for an academy that provides practical knowledge, expert guidance, and continuous support throughout their learning journey. At Trade Sutra Trading Academy (TSTA), our goal is to help learners build a strong foundation in the stock market through structured education and practical learning. Here are some of the reasons why traders choose TSTA for their option trading education.
1. Learn Through Real Market Examples
At TSTA, we believe that the best way to understand the stock market is by learning through real market situations. Rather than relying only on theoretical concepts, our educators explain strategies using live charts, historical examples, and practical market scenarios. This approach helps students understand how trading concepts work in different market conditions and improves their ability to apply what they learn.
2. Structured Learning from Beginner to Advanced
Our courses are designed with a step-by-step learning approach so that students can build their knowledge gradually. Beginners start by learning stock market fundamentals, while experienced traders can explore advanced option trading concepts and strategies. This structured learning path allows students to develop confidence as they progress from basic to advanced topics.
3. Guidance from NISM Certified Educators
One of the strengths of TSTA is that students learn from NISM Certified Educators. Our educators combine industry-recognized knowledge with practical market experience to explain trading concepts in a simple and easy-to-understand way. Their guidance helps learners understand market behavior, trading principles, and disciplined trading practices with greater clarity.
4. Focus on Practical Trading Skills
Trading is a practical skill that improves through proper learning and application. At TSTA, we focus on helping students develop skills they can use in real market conditions. From reading charts and understanding price action to planning trades and managing positions, our courses are designed to bridge the gap between theory and practical trading.
5. Learn with a Disciplined Trading Approach
Successful traders follow a disciplined approach instead of making emotional decisions. At TSTA, students learn the importance of planning trades, following trading rules, managing risk, and maintaining consistency. We encourage a structured trading approach that helps learners build good trading habits and make more informed decisions over the long term.
How the Right Trading Academy Can Save You Time and Money
Learning option trading is an investment of both time and money. Many aspiring traders spend months switching between YouTube videos, online articles, and social media tips without following a clear learning path. This often leads to confusion, inconsistent results, and unnecessary expenses.
Choosing the right trading academy from the beginning can help you learn more efficiently, avoid common setbacks, and make better use of your time and resources. Rather than learning through constant trial and error, you gain a structured roadmap that helps you progress with clarity and purpose.
1. Avoid Expensive Learning Mistakes
Many new traders spend money on multiple short courses, paid tips, software subscriptions, or strategies that do not match their experience level. These unnecessary expenses can add up quickly without providing real value. A well-structured trading academy helps you focus on the right concepts from the beginning, reducing the need to repeatedly invest in different learning resources.
2. Spend Less Time Searching for Information
The internet offers an endless amount of trading content, but not all of it is accurate or suitable for beginners. Learners often spend hours trying to decide which information is reliable. A professional trading academy organizes all the essential topics into one learning path, allowing students to spend more time learning and less time searching for answers.
3. Avoid Switching Between Multiple Learning Sources
Many beginners try to learn from several trainers at the same time. While this may seem helpful, different teaching methods and trading approaches often create confusion. Learning through a single, structured curriculum allows you to understand concepts in the correct sequence and build your knowledge more effectively.
4. Make Better Use of Your Learning Investment
Joining a quality trading academy is not just about completing a course—it's about gaining skills that you can continue using over time. When a course includes practical learning and experienced educators students receive greater value from the time and money they invest in their education.
Choosing the top option trading academy in India is not simply about selecting a course—it is about choosing a learning experience that helps you use your time wisely, avoid unnecessary expenses, and build skills that support your long-term trading goals. A structured learning journey today can save months of confusion and help you grow with greater confidence in the future.ing rules, managing risk, and maintaining consistency. We encourage a structured trading approach that helps learners build good trading habits and make more informed decisions over the long term.
Learn Option Trading with Confidence
Build your option trading knowledge with Trade Sutra Trading Academy (TSTA) and learn through a structured, practical approach designed for traders at every level. Our expert-led courses combine market fundamentals, price action, option strategies, risk management, and live market learning to help you develop real trading skills.
Guided by NISM Certified Educators, you'll gain the confidence to analyse the markets, make informed decisions, and continue growing as a trader. Begin your option trading journey with TSTA and take a step toward smarter, more disciplined trading.
Conclusion
Choosing the top option trading academy in India is an important step for anyone who wants to build a strong foundation in the stock market. The right academy should offer more than just trading strategies—it should provide structured learning, practical market experience, guidance from experienced educators, and a focus on risk management, trading psychology, and disciplined decision-making.
Before enrolling, take time to compare academies, review the course curriculum, understand the teaching approach, and choose a program that matches your learning goals. Investing in quality trading education can help you develop the knowledge and confidence needed to make informed trading decisions and continue improving over time.
If you're looking for a structured and practical way to learn option trading, Trade Sutra Trading Academy (TSTA) offers beginner-friendly and advanced courses designed to help you understand the markets with confidence. With guidance from NISM Certified Educators, live market learning, and a practical approach to trading, TSTA helps you build the skills needed for long-term growth in the financial markets.
Frequently Asked Questions
How do I choose the top option trading academy in India?
Look for an academy that offers a structured curriculum, experienced educators, practical market training, and risk management education. Comparing these factors can help you choose the right academy for your learning goals.
What should I look for before joining an option trading academy?
Before enrolling, review the course syllabus, trainer qualifications, teaching approach, practical learning opportunities, and student reviews to ensure the academy meets your expectations.
Is option trading difficult for beginners to learn?
Option trading can seem complex initially, but with structured learning and step-by-step guidance, beginners can understand the concepts and gradually build practical trading skills.
What is option trading?
Option trading is the buying and selling of option contracts based on stocks or indices. It allows traders to benefit from market movements without owning the underlying asset. Traders use option trading to manage risk and apply different trading strategies
Why is professional option trading education important?
Professional education provides a systematic approach to learning market fundamentals, option strategies, technical analysis, and risk management, helping traders build a strong foundation.
Should I choose an online or offline option trading academy?
Both learning formats have advantages. Online courses offer flexibility, while offline classes provide face-to-face interaction. The best choice depends on your learning style, schedule, and personal preferences.
What topics should a good option trading course cover?
A comprehensive course should include stock market basics, option trading fundamentals, technical analysis, option chain analysis, price action, trading psychology, money management, risk management, and option trading strategies.
Why is practical learning important in option trading?
Practical learning helps traders understand how trading concepts work in real market conditions through chart analysis, live market sessions, and real trading examples.
How important is risk management in option trading?
Risk management is essential because it helps traders protect their capital, control losses, and make disciplined trading decisions regardless of market conditions.
What are the benefits of learning from NISM Certified Educators?
NISM Certified Educators provide structured market knowledge, explain financial concepts clearly, and help students develop a better understanding of trading principles and market practices.
Can I learn option trading without any stock market experience?
Yes. Many trading academies offer beginner-friendly courses that start with stock market fundamentals before introducing advanced option trading concepts.
How long does it take to learn option trading?
The learning period depends on the course structure and the time you dedicate to practice. Building trading skills is an ongoing process that improves with continuous learning and market experience.
What is the biggest mistake people make when choosing a trading academy?
Many learners choose an academy based only on low fees or marketing claims instead of evaluating the course quality, trainer experience, and practical learning opportunities.
Are live market sessions useful for option trading?
Yes. Live market sessions allow students to observe real-time market analysis, trading setups, and decision-making, making it easier to understand practical trading concepts.
Why is trading psychology included in option trading courses?
Trading psychology helps traders control emotions such as fear and greed, follow a trading plan, and make disciplined decisions during changing market conditions.
Can working professionals learn option trading?
Yes. option trading academies offer flexible online courses that allow working professionals to learn at their own pace without affecting their daily schedules.
How do I know if an option trading course is suitable for me?
Review the course curriculum, learning objectives, teaching style, and skill level to ensure the course matches your experience and trading goals.
Why is a structured learning approach better than self-learning?
Structured learning follows a logical sequence, helping students understand concepts step by step while reducing confusion caused by learning from multiple unorganized sources.
What makes TSTA a trusted choice for option trading education?
TSTA offers structured courses, practical market learning, guidance from NISM Certified Educators, live market sessions, and specialized programs designed for both beginners and experienced traders.
How long does it take to become good at option trading?
The time varies for each person. With proper training, regular practice, and a disciplined approach, many beginners build a good understanding within a few months. Consistent learning and real market experience are key to improving your trading skills.
Do I need a large amount of money to start learning option trading?
No. Learning option trading does not require a large investment. You can begin by building your knowledge and understanding market concepts before trading with real capital.
Which is the top option trading academy in India?
The right academy depends on your learning goals, course requirements, and preferred teaching style. When comparing academies, look for structured education, experienced educators, and practical training. Trade Sutra Trading Academy (TSTA) is one option that offers these features through its comprehensive trading courses.